

From Chief Investment Officer Tom Veale,
“This week’s report has three of the four MRI components rising modestly in their own risk range. This pushed the Market Risk Indicator up yet one more point to 24% suggested cash for diversified stock portfolios. Our MRI Oscillator shows +5 suggesting continued upward risk pressure. While still below the median value, it has been closing the gap. Note in the histogram the S&P 500’s nearly continuous rise while the MRI remained in the yellow band. This bodes well for markets going forward. From the start of the latest Low Risk signal (12/28/2018) the Nasdaq Composite Index has risen over 23%. The S&P 500 has risen over 19% in the same period. This latest bullish MRI signal has proved to be valuable for those following its contrary advice.”
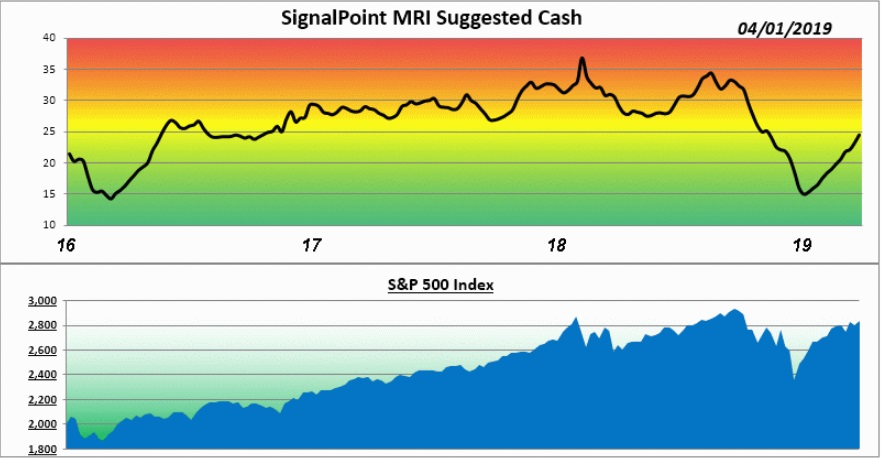
The Market Risk Indicator (MRI) is an assessment tool that serves as a guide through all markets as to the prudent use of a liquid cash cushion. It helps determine an approximation of the amount of cash reserve relative to a diversified equity portfolio. (this is depicted by the graph above)
At times of high risk in the market, the MRI will suggest a higher level of cash reserve. At times of low market risk, the MRI will suggest a lower level of cash reserve. This investment process helps to measure and manage market risk.
Because of this, the fear associated with the uncertainty of the market can be replaced by the security of a sound investment strategy.