

From Chief Investment Officer Tom Veale,
In recent weeks we have seen the SinglePoint Market Risk Indicator (MRI) level off after climbing most of 2021 so far. This week the MRI remains bearish for the 38th week but declines one point to 46. The MRI Oscillator comes in at minus 1, indicating only slight downward pressure on market risk.
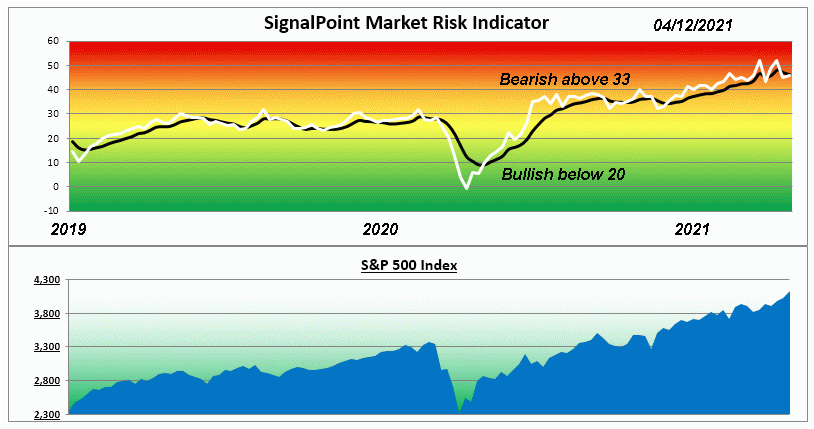
Only one of the four components of the MRI is currently neutral – our Divergence Index. The other three are bearish. After a one week pause our Speculation Index returned this week to being bearish. Overall, most views of last week’s activity showed positive gains despite current risk conditions. Only renewable energy stocks dropped generally in price last week. Of note are ETFs representing non-U.S. stocks. This helped our International Signal and Universal Signal portfolios along with Global Signal.
We continue to see some differences between the NYSE and NASADQ Composite indexes. In this next histogram we see some of the recent performance differential. The risk measure, v-Wave, is derived from Value Line’s weekly “Appreciation Potential” indicator. In general, the v-Wave has followed the same general path as our MRI.
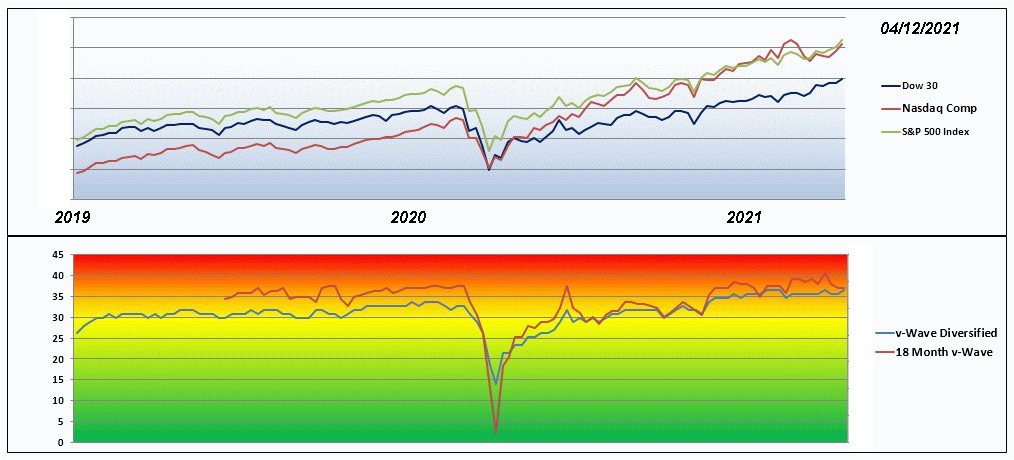
Since last year’s market low point both the S&P 500 and the NASDAQ Composite have out-paced the Dow 30 Index. This may be a capitalization effect as much as anything. The 30- stock limit of the Dow holdings is another big factor. When the v-Wave is above 34, it is bearish and below 24 it is bullish. Median is 29.5. Currently it is in its 21st week of being bearish.
Best regards,
Tom Veale