From Chief Investment Officer Tom Veale,
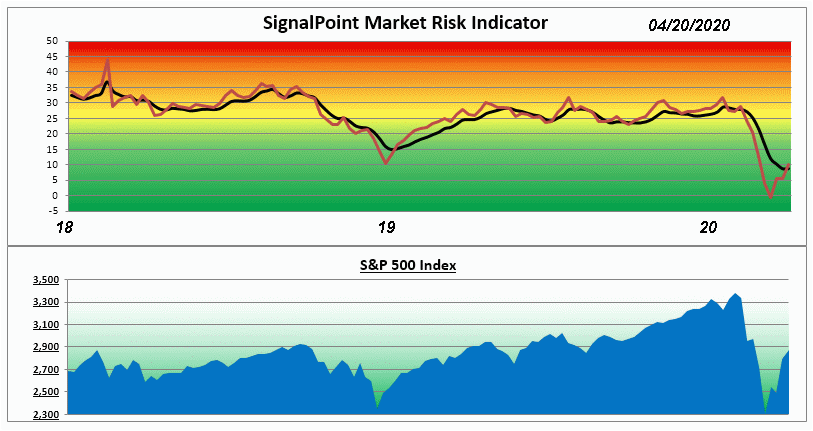
“Another week of modest improvement in the market indexes coincides with the SignalPoint Market Risk Indicator (MRI) remaining flat at 9 and deeply bullish. The MRI Oscillator rises to +2 indicating a very modest increase in market risk pressure this week. It was in May of 2009 when the MRI was last as low as it is now, but it had been rising for two months at that point.”

”Two MRI components remain bullish this week (Relative Valuation and Speculation) while one (Divergence) remains threshold bullish. Three rose modestly and one remained unchanged.
It now takes just a 20% rise in price over the latest 13 weeks to get a company listed on the “Best Performers” list in Value Line. Compare that to the drop of nearly 71% over the same period to get a company listed on the “Worst” list. It appears there is still hesitation by many investors to return their nest eggs to the stock market. Value Line’s “Worst” list is still littered with the debris of energy, energy services and resources companies. Surely one could find something of long term potential value if one studied carefully those sectors.
Unlike some of the flawed models used to guide bureaucrats relative to the latest virus, the Market Risk Indicator has a long history of relative success. From the start of an MRI bullish signal , here’s the average Nasdaq Composite change over various time frames:
| Time Frame | Nasdaq Change | Nasdaq Average Change (since 01/1982) |
| At 4 Weeks | +4.6% | +0.91% |
| At 3 Months | +11.5% | +3.1% |
| At 6 Months | +17.4% | +6.4% |
| At 9 Months | +19.5% | +9.9% |
| At 12 Months | +23.9% | +13.4% |
It is too soon to tell if this economic crisis brought on by C-19 will offer similar results over time. So far, we are now in the 5th week since the start of the current bullish MRI signal. In the first 4 weeks since it turned bullish the NASDAQ Composite has risen 18.5% while the S&P 500 has risen 21%. That indicates a good start compared to average gains from previous bullish signals.”
The Market Risk Indicator is an assessment tool that serves as a guide through all markets as to the prudent use of a liquid cash cushion. It helps determine an approximation of the amount of cash reserve relative to a diversified equity portfolio. (this is depicted by the graph above)
At times of high risk in the market, the MRI will suggest a higher level of cash reserve. At times of low market risk, the MRI will suggest a lower level of cash reserve. This investment process helps to measure and manage market risk.
Because of this, the fear associated with the uncertainty of the market can be replaced by the security of a sound investment strategy.


