From Chief Investment Officer Tom Veale,
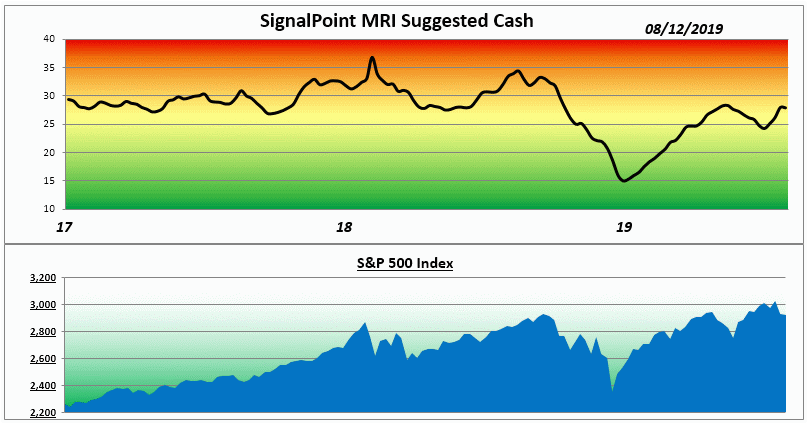
“Last week’s trading probably didn’t do a lot to inspire confidence for investors. The indexes traded off for the week while the statistics shifted in the wind. SignalPoint’s Market Risk Indicator (MRI) remained at 28% suggested cash for long term diversified portfolios while the MRI Oscillator dropped to zero showing no upward or downward pressure on risk. Three of the four components dropped in risk profile during the week and one remained unchanged.”

“SignalPoint’s Relative Valuation Index dropped nicely toward the bottom if its neutral range as did the Speculation Index. Both are quite close to their bullish thresholds. In the meantime the Divergence Index remains bearish but improved slightly from a week ago. This is the 4th week of bearishness for that component.
The average yield shown in Value Line after last week’s trading rose to 2.3% for stocks that pay dividends. That’s slightly better than the 2.033% coupon yield for the 13 Week Treasury rate at the close last Friday. This would indicate that dividend oriented stocks and funds may offer some value relative to the “Risk Free Rate of Return” of short term treasuries.”
The Market Risk Indicator is an assessment tool that serves as a guide through all markets as to the prudent use of a liquid cash cushion. It helps determine an approximation of the amount of cash reserve relative to a diversified equity portfolio. (this is depicted by the graph above)
At times of high risk in the market, the MRI will suggest a higher level of cash reserve. At times of low market risk, the MRI will suggest a lower level of cash reserve. This investment process helps to measure and manage market risk.
Because of this, the fear associated with the uncertainty of the market can be replaced by the security of a sound investment strategy.


