

From Chief Investment Officer Tom Veale,
“It’s a Bird, It’s a Plane, It’s a Black Swan!”
Opinions are all over the place on the subjects of Coronavirus and Politics as well as the usual economic and the stock market news. Here are some facts from Franklin/Templeton’s weekly “What Happened Last Week” newsletter:
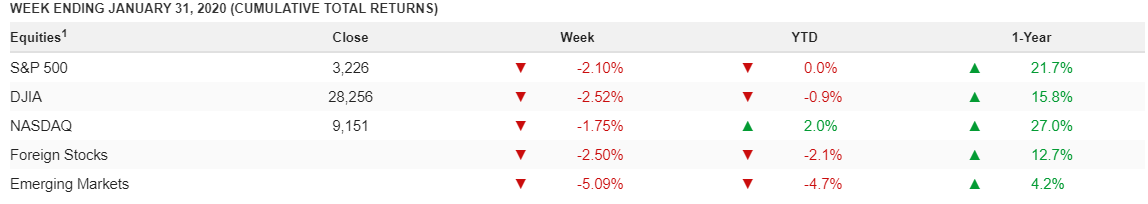
It’s not yet clear whether Coronavirus is a dreaded Black Swan event or just one piece of straw added to an overburdened camel. On a weekly and YTD basis we see the damage done and can only be thankful the 12 month history is still mostly intact. The SignalPoint Process didn’t know a big black bird would fly over in January but had been accumulating cash in reserve for such an event for a long time. If warranted, the Process will be available to rebuild share inventory should things worsen in the future.
Our Market Risk Indicator (MRI) also responded to last week’s trading. First, our Divergence Index had been at the lower end of its neutral range since the start of the year. It rose well into its bearish range with the decidedly high number of both new 52 week highs and lows registered simultaneously. Last week also saw poor absolute market breadth as declining stocks outnumbered advancers by more than a 2:1 margin. This is the second week of poor market breadth and acts as confirmation of the bearish signal from the Divergence Index.
At the same time, the retreat of the general markets brought down median Price/Earnings Ratios that had been rising for some time. Along with the contraction in P/E we see the median dividend yield rise slightly as a mathematical response (no change in payout, just in percentage of share value). Also, as enthusiasm sublimated we see our Speculation Index fall off to below its median historical value.”
“The combination of MRI Component activity pushed the MRI’s value up two points to 29% suggested cash being held in reserve for diversified stock accounts. The MRI Oscillator rose to +5 this week indicating significant upward risk pressure (almost all derived from the bearish Divergence component).
Overall we have three MRI components neutral and one bearish at this time. Substantial reserves of cash and equivalents should help buffer any draft from the wings of black swans.”
The Market Risk Indicator is an assessment tool that serves as a guide through all markets as to the prudent use of a liquid cash cushion. It helps determine an approximation of the amount of cash reserve relative to a diversified equity portfolio. (this is depicted by the graph above)
At times of high risk in the market, the MRI will suggest a higher level of cash reserve. At times of low market risk, the MRI will suggest a lower level of cash reserve. This investment process helps to measure and manage market risk.
Because of this, the fear associated with the uncertainty of the market can be replaced by the security of a sound investment strategy.