From Chief Investment Officer Tom Veale,
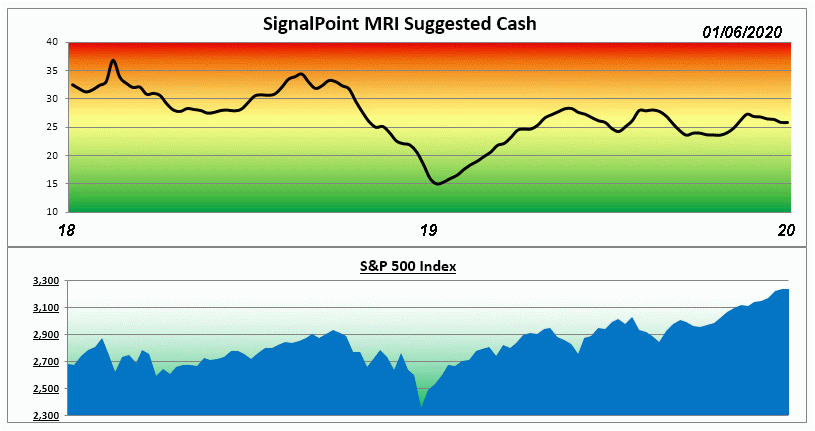
“With just two days of trading in the New Year it’s a bit hard to discern a pattern as of yet. One day showed there is lots of investor enthusiasm and the other provided a background of honking Black Swans. With back to back short trading weeks the Market Risk Indicator data calculates to No Change at 26% suggested cash being held for diversified stock portfolios. The MRI Oscillator rises to +3 showing mild upward risk pressure this week.”

“Two MRI components were unchanged this week while one each rose and fell on the data. The Speculation Index component has been rising toward its bearish threshold but is still in the neutral range. All the remaining components are also neutral.
The US Domestic portfolio, Signal 10, currently has all components except the Energy ETF within 10% of their next incremental selling target prices. The exUS strategy, International Signal, sits with all but two components within 10% of sell targets and the remaining two are only 13% away. Our globally diversified balanced portfolio, Universal Signal, has all but three components within 10% of their next incremental sell targets. This describes how well things have been going since the low point at the end of 2018.”
The Market Risk Indicator is an assessment tool that serves as a guide through all markets as to the prudent use of a liquid cash cushion. It helps determine an approximation of the amount of cash reserve relative to a diversified equity portfolio. (this is depicted by the graph above)
At times of high risk in the market, the MRI will suggest a higher level of cash reserve. At times of low market risk, the MRI will suggest a lower level of cash reserve. This investment process helps to measure and manage market risk.
Because of this, the fear associated with the uncertainty of the market can be replaced by the security of a sound investment strategy.


