From Chief Investment Officer Tom Veale,
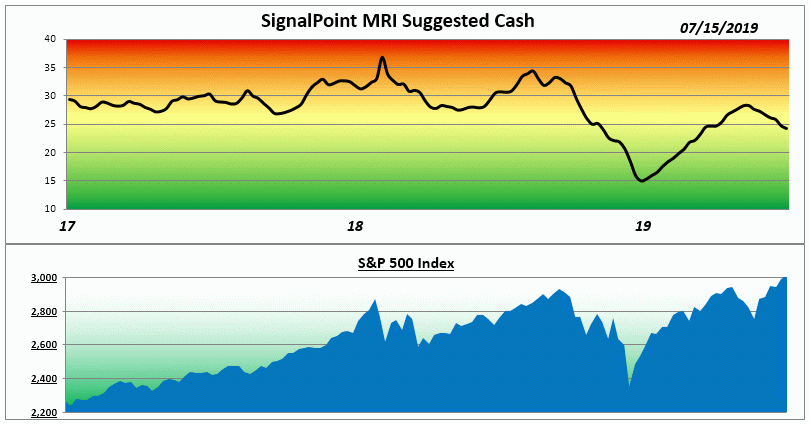
“This previous week’s trading provided investors with new highs in several of the market indexes. However, it left our Market Risk Indicator (MRI) with a modest decline in risk. This week we see the MRI at 24% suggested cash for diversified stock portfolios, down one point from last week. The MRI Oscillator is now zero indicating no upward or downward pressure on risk. The MRI components were barely changed from a week ago with all four being neutral right now.”

“This leaves us with the MRI slightly below its median value (since 1982) and modestly to the bullish side of its history.
The interest rate yield curve remains slightly inverted at the current moment but the range is very narrow. We note that the long maturity bond funds we use (TLT) in income portfolios dropped slightly from its recent peak letting its effective yield flatten and start to rise. With the yield curve being so flat there is little incentive for investors to own longer maturity securities over even 13 Week Treasuries.”
The Market Risk Indicator is an assessment tool that serves as a guide through all markets as to the prudent use of a liquid cash cushion. It helps determine an approximation of the amount of cash reserve relative to a diversified equity portfolio. (this is depicted by the graph above)
At times of high risk in the market, the MRI will suggest a higher level of cash reserve. At times of low market risk, the MRI will suggest a lower level of cash reserve. This investment process helps to measure and manage market risk.
Because of this, the fear associated with the uncertainty of the market can be replaced by the security of a sound investment strategy.


