

From Chief Investment Officer Tom Veale,
“It could be surmised that most investors are glad to see the first half of 2020 come to an end. Some roller coasters are just not that much fun. This first report of the second half of the year shows the Market Risk Indicator ticking up one more point to 29 which is still neutral but three points above its median value. The MRI Oscillator shows +7 which suggests there is still upward pressure on market risk.”
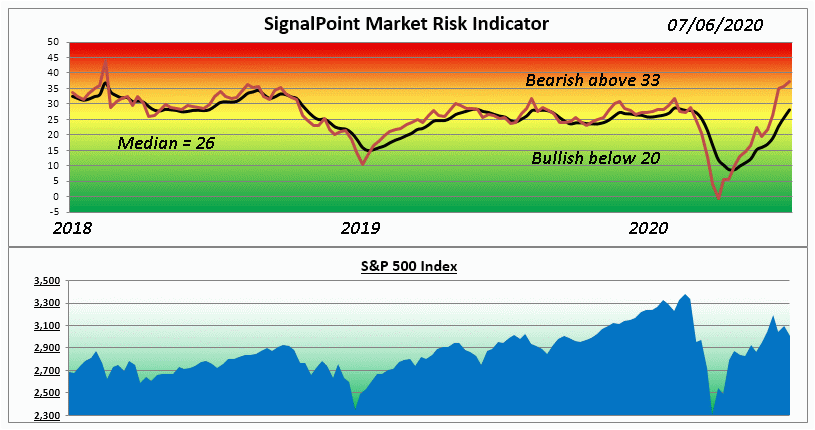
“The four MRI components give a mixed review with two rising and two falling slightly in their own risk ranges. Two are currently bearish (Relative Valuation and Speculation) while one is neutral (IPO Activity) and one is bullish (Divergence).
It takes a gain of over 123% over the last 13 weeks for a company to make the “Best Performers” list in Value Line. Compare that to the modest decline of just -13% needed to make it onto the “Worst” list and one gets a feel of just how rapidly money has been flowing back into stocks.
Yields for common stocks still have a compelling appearance with Value Line’s median dividend being about 2.5% right now. Compared to most every spot on the Yield Curve, stocks look quite generous in pay-out. As we see second quarter earnings reported we will get a better feel for how secure the stock dividends are.”
The Market Risk Indicator is an assessment tool that serves as a guide through all markets as to the prudent use of a liquid cash cushion. It helps determine an approximation of the amount of cash reserve relative to a diversified equity portfolio. (this is depicted by the graph above)
At times of high risk in the market, the MRI will suggest a higher level of cash reserve. At times of low market risk, the MRI will suggest a lower level of cash reserve. This investment process helps to measure and manage market risk.
Because of this, the fear associated with the uncertainty of the market can be replaced by the security of a sound investment strategy.