From Chief Investment Officer Tom Veale,
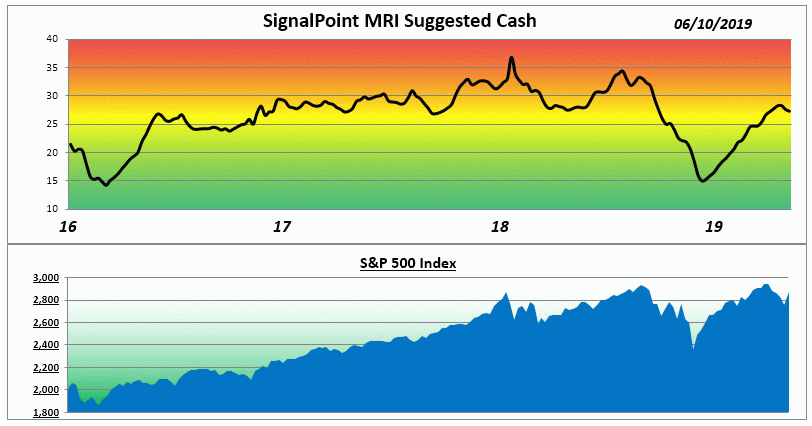
“A trade-off of two Market Risk Indicator components rising and two falling gave bias to the falling side. This brought the MRI suggested cash down by one point to 27% for diversified equity portfolio strategies. The MRI Oscillator is minus 1 indicating slight downward pressure on market risk going forward. Again this week the Divergence component is the only one in its bearish range with the rest solidly neutral.”

“The market pull-back from the April highs has been enough curtail rising market risk and offer some better valuations. “Algo” trading would appear to be over-stimulated in trading on very marginal news events. This gives the markets the appearance of being volatile even as the market internals remain relatively steady. The only places we see increased bearishness is in our Divergence Index and in cumulative market breadth. The weekly Advance/Decline ratio has been bias to the declining side now for five weeks. The week of May 6th was the last time advancing issues outnumbered declining ones. That trend seemed to be moderating toward the end of last week. We’ll see if this week’s trading offers further improvement.”
The Market Risk Indicator is an assessment tool that serves as a guide through all markets as to the prudent use of a liquid cash cushion. It helps determine an approximation of the amount of cash reserve relative to a diversified equity portfolio. (this is depicted by the graph above)
At times of high risk in the market, the MRI will suggest a higher level of cash reserve. At times of low market risk, the MRI will suggest a lower level of cash reserve. This investment process helps to measure and manage market risk.
Because of this, the fear associated with the uncertainty of the market can be replaced by the security of a sound investment strategy.


