

From Chief Investment Officer Tom Veale,
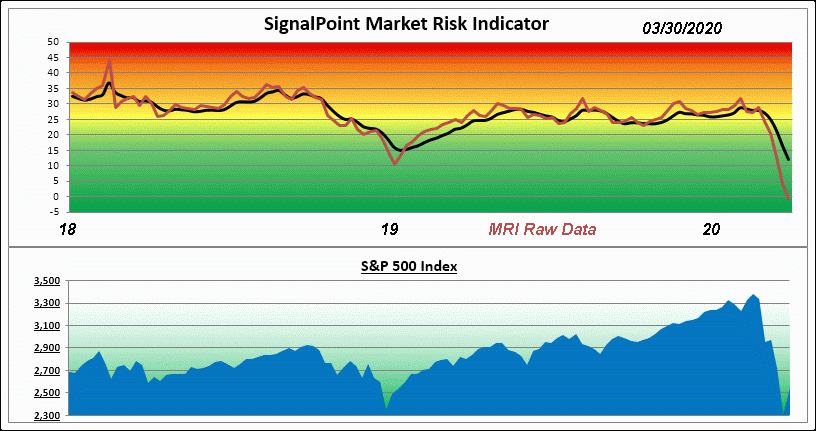
“It appears that the SignalPoint Market Risk Indicator has been keeping up with the markets quite well so far. This week shows the MRI diving even deeper into the Bullish territory (20 and below) as it drops to 12 – a decline of 4 points this week. The MRI raw, unsmoothed data actually dropped to below zero (a very rare occurrence). The current MRI Oscillator is again minus 19 indicating rapidly declining market risk.”
“Three of the MRI’s components dropped further into their own bullish territories this week – the Relative Valuation, Speculation and Divergence Indexes all are strongly bullish right now. It is quite rare to have this strong of a bullish consensus with these different views of the market condition. Of note this week is a further rise in average Dividend Yield in Value Line to 3.7%. With zero interest rates, steady current inflation and a deeper drop in Value Line’s average Price/Earnings ratio the average stock yield becomes a compelling argument for being invested in stocks, stock ETFs and corporate bonds and preferred ETFs.
While Value Line’s average Price/Earnings ratio again dropped this week (to 11.0) we can all assume that Q-1, 2020 earnings will start to show some stress. It can be surmised that Q-2, 2020 will be nearly unimaginable in declines or losses. This would lead us to suspect the bottoming process for the markets will be a long and bumpy activity. Even outlook for Q-3 earnings will most likely be negatively affected. If we add to this the U.S. presidential election coming in November we foresee a tough year in 2020.
It could be that we’ve already seen the yearly market lows. So much of what we’ve seen in recent weeks has been in anticipation of the current viral outbreak and its potential effects on the economy. Does this mean the markets have already built in ‘worst case scenario?’ Or is the worst yet to come? In either case we see the MRI deeply into its Bullish territory. From past experience when the MRI has been in this range the markets have been far closer to their “bottom” than further free-fall. Downside risk is now far less than at the start of 2020. The other side of that coin is that Upside potential has expanded nicely.”
The Market Risk Indicator is an assessment tool that serves as a guide through all markets as to the prudent use of a liquid cash cushion. It helps determine an approximation of the amount of cash reserve relative to a diversified equity portfolio. (this is depicted by the graph above)
At times of high risk in the market, the MRI will suggest a higher level of cash reserve. At times of low market risk, the MRI will suggest a lower level of cash reserve. This investment process helps to measure and manage market risk.
Because of this, the fear associated with the uncertainty of the market can be replaced by the security of a sound investment strategy.