From Chief Investment Officer Tom Veale,
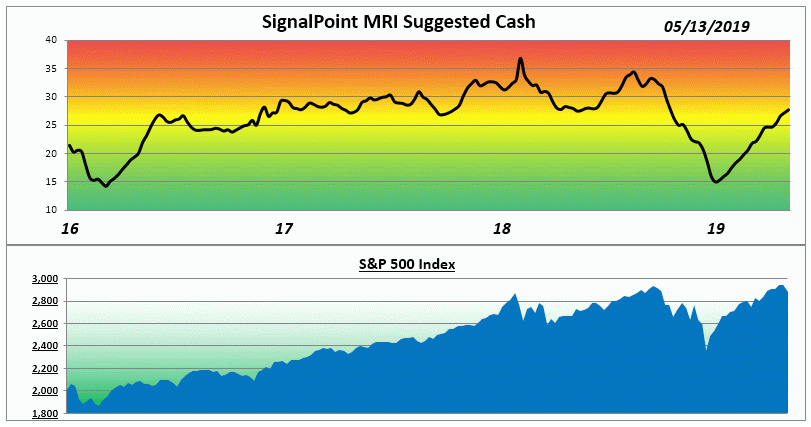
“Inside the Market Risk Indicator we saw opposing trends with two components rising and two falling in their own risk profiles. The confused environment last week had investors betting on both sides pushing up the number of 52 week new Lows and Highs to a bearish point. This we measure with our Divergence Index. On the other side, we saw a significant contraction of Value Line’s median Price/Earnings ratio (dropping from 18.2 to 17.1) which lowered our Relative Valuation Index nicely and below its median value. The result reduced the upward pressure on overall market risk but the MRI still rose one point to 28% suggested cash for now. The MRI Oscillator dropped to +1 showing very little upward risk pressure.”

The MRI is now two points above its median value but still in Neutral territory. Diversified portfolios should continue to maintain essentially the same cash insurance as before.”
The Market Risk Indicator is an assessment tool that serves as a guide through all markets as to the prudent use of a liquid cash cushion. It helps determine an approximation of the amount of cash reserve relative to a diversified equity portfolio. (this is depicted by the graph above)
At times of high risk in the market, the MRI will suggest a higher level of cash reserve. At times of low market risk, the MRI will suggest a lower level of cash reserve. This investment process helps to measure and manage market risk.
Because of this, the fear associated with the uncertainty of the market can be replaced by the security of a sound investment strategy.


