

From Chief Investment Officer Tom Veale,
“Our Market Risk Indicator starts May with an uptick in risk of one point to 11, a number still quite bullish (Neutral range = 20 to 33).”
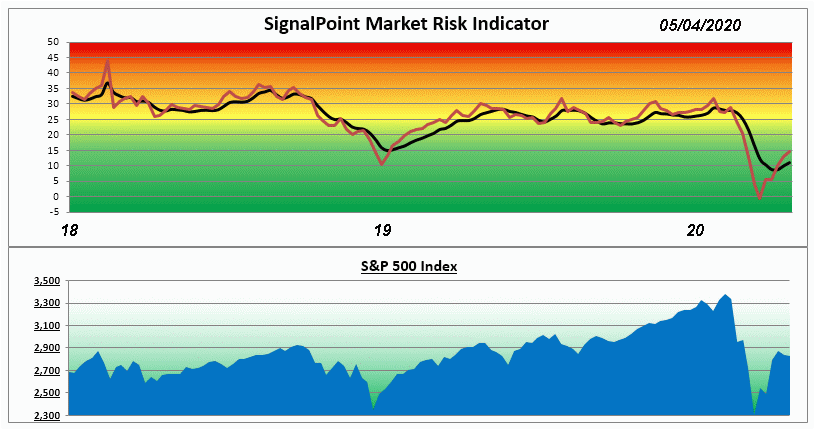
”However, one has to look at the MRI Oscillator to see the rest of the story. It is now +5 indicating a significant upward push on market risk. Three of the four MRI components moved upward with two neutral and two still quite bullish. Of the neutral components Relative Valuation is only fractionally above its own bullish territory (but rising).
Advancing stocks outnumbered decliners last week even as the cap weighted indexes were flat. Indication is the large cap stocks of the Dow and S&P 500 drove the indexes up from their March lows while small and mid cap stocks were lagging. Last week saw the small and mid cap stocks being favored over the large caps. Indexes (cap weighted) remained flat as the Equal Weight S&P Index moved ahead.”
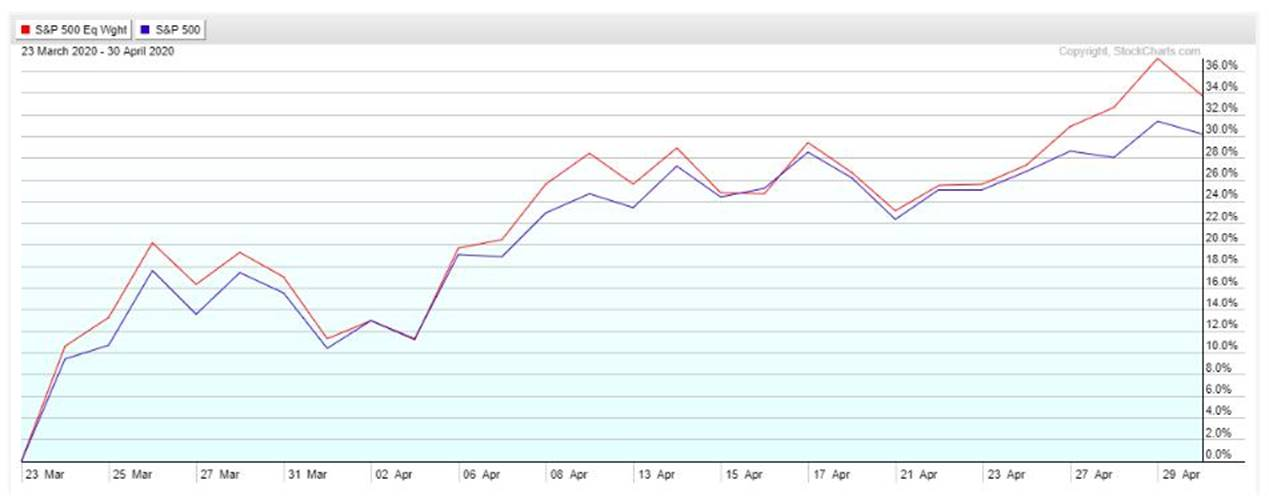
“This more selective approach to money flow returning to the market place should help reduce volatility going forward if it continues. Both the small and mid cap ETFs rose last week even as the big indexes stalled.”
The Market Risk Indicator is an assessment tool that serves as a guide through all markets as to the prudent use of a liquid cash cushion. It helps determine an approximation of the amount of cash reserve relative to a diversified equity portfolio. (this is depicted by the graph above)
At times of high risk in the market, the MRI will suggest a higher level of cash reserve. At times of low market risk, the MRI will suggest a lower level of cash reserve. This investment process helps to measure and manage market risk.
Because of this, the fear associated with the uncertainty of the market can be replaced by the security of a sound investment strategy.