

From Chief Investment Officer Tom Veale,
“Nervous markets continue to show distrust in the 2019 stock rally. The Advance/Decline cumulative breadth has softened in recent weeks while there continues to be a large number of new 52 week highs and lows simultaneously. This is why we see our Divergence Index climbing deeper into its bearish territory. It, however, is the only component this week that moved. The others remain unchanged.”
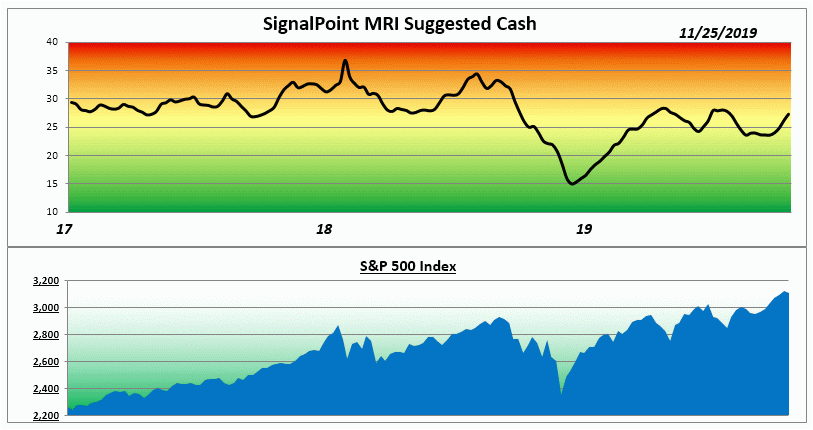
“The result is we see the SignalPoint Market Risk Indicator (MRI) rising one more percentage point to 27% suggested cash for diversified stock portfolios. The MRI Oscillator still shows upward risk pressure with a +5 rank for this week. Three neutral components and one bearish doesn’t suggest much that is definitive about the near term future of the markets other than a potential pause for now.
Again this week we find the 13 week Treasury Coupon yielding an interest rate that is less than the current CPI All Urban Inflation Rate. While historically unusual this has been the norm through much of the past 19 years. Concern about the Yield Curve seems to have quieted with the current nearly flat trajectory of maturities out through the ten year bond.”
The Market Risk Indicator is an assessment tool that serves as a guide through all markets as to the prudent use of a liquid cash cushion. It helps determine an approximation of the amount of cash reserve relative to a diversified equity portfolio. (this is depicted by the graph above)
At times of high risk in the market, the MRI will suggest a higher level of cash reserve. At times of low market risk, the MRI will suggest a lower level of cash reserve. This investment process helps to measure and manage market risk.
Because of this, the fear associated with the uncertainty of the market can be replaced by the security of a sound investment strategy.