From Chief Investment Officer Tom Veale,
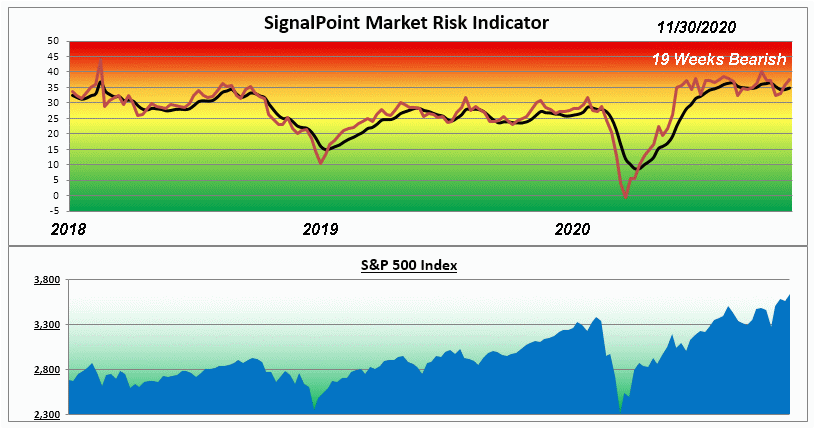
“It’s difficult to see why the SignalPoint Market Risk Indicator has been bearish for 19 weeks when the market indexes have continued to rise. Since the end of July the Nasdaq Composite Index has risen 17.7%, the S&P 500 is up 13.1% and the Dow 30 “Industrials” has climbed 13.0%. Is it just plain wrong this time? Or are there pressures rising that are not being recognized by the latest generation of investors?”

“This week brings three of the four MRI components into their own bearish ranges (Relative Valuation, Speculation and IPO/New Issues indexes). Only our sentiment component, Divergence Index, is bullish. There’s confirmation of the bullish Divergence Index when we view the recent Advances versus Declines. Last week 2959 issues on the NASDAQ advanced compared to just 768 issues showing declines. Only 1.1% of the issues traded last week posted new Lows. It would appear that investors are convinced the future contains no clouds or storms.
The MRI rose to 35 this week, up one point from a week ago and is bearish. The MRI Oscillator rose to +4 indicating building risk pressure. While bearish signals from the MRI don’t always end in disaster, they do tend to indicate below average returns looking 3 to 12 months out into the future. This can be understood to a degree when one realizes there really aren’t that many alternatives for reasonable returns open for investors. Even at the lofty market measures we see the average Value Line dividend paying stock yielding 2.0% where the 10 Year U.S. Treasury coupon rate is still sub-1% right now.
We continue to carefully watch for profit opportunities and monitor our reserves of cash in light of the unusual market conditions.”
The Market Risk Indicator is an assessment tool that serves as a guide through all markets as to the prudent use of a liquid cash cushion. It helps determine an approximation of the amount of cash reserve relative to a diversified equity portfolio. (this is depicted by the graph above)
At times of high risk in the market, the MRI will suggest a higher level of cash reserve. At times of low market risk, the MRI will suggest a lower level of cash reserve. This investment process helps to measure and manage market risk.
Because of this, the fear associated with the uncertainty of the market can be replaced by the security of a sound investment strategy.


